Finance Tool Update

I have managed to reach my goal with developing a tool, but lets talk about the weird timing first. Just as I was about to start using the tool, the stock market crash of the century happened. Basically throwing a lot of doubt on if was was going to be able to use the strategies I came up with before the crash. So I was hesitant to jump into the fresh post-crash market and decided to wait a few weeks. I wanted to see that the market was stable before I jumped on it. I will talk about how the last few months have been going, but lets get back to the tool.
The Tool
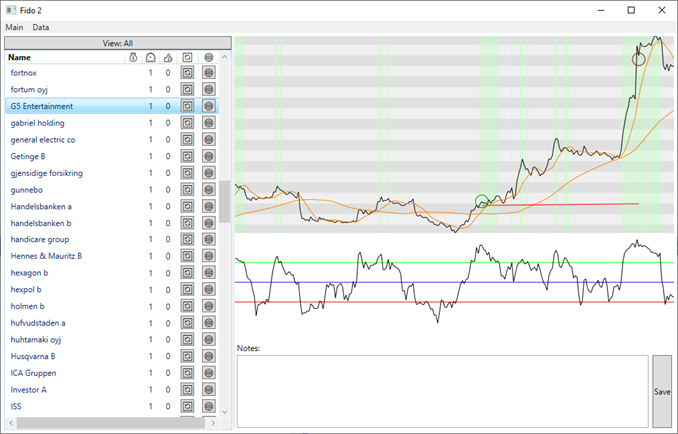
Technically, I have written two tools. One for downloading stock data and one for displaying graphs and analysis. I was worried that getting hold of daily stock data would be an issue, but luckily my broker don’t seem to mind that I download it directly from them (at least not with the low frequency I’m doing it with).

And once I have fresh data, I start my second tool and check which stocks have reached my triggers. My triggers are very basic ones that are based on SMA crossovers and RSI levels. Nothing fancy, just very basic Technical Analysis stuff.
I take a look at the companies that reached the triggers and basically use my gut feeling to select which ones to invest in.
I use the tools about once per week. That is about how often I want to sit down and think about stocks.
The results
I been thinking about how I should measure the success of this endeavor. Firstly I think any profit at all should be considered a success for an amateur like me. I’m happy as long as I don’t loss any money on this.
But “losing money” can be defined in different ways. Lets say I didn’t put any money into this project, but instead put it into an index fund or any other professionally managed fund? One could say I lost money if my project resulted in a lesser profit than what I would have gotten if I invested in a fund.
Because of this thinking I decided that I would measure the success of this project against the average result of all the funds I’m currently invested in. The funds, that if I didn’t want to manage stock holding myself, I would probably have put the money into.
I’m thinking that if I, in the long run, can’t beat the professionals then I should probably invest in them instead and spend my time on other things.
My result: 11.46%
Average result of funds I’m invested in: -2,74%
That is a difference of 14,2 percent units! And not only did I have higher profit, I would have less money if invested in all my funds instead. Not the result I was expecting if I’m honest.
Now these last months have been unprecedented and I have had the luxury of deciding when I wanted to be in the market and not. I don’t think I can expect this type of result in the future.
(I’m comparing results from when I started to use my tools, right before crash, and not when I entered the market.)
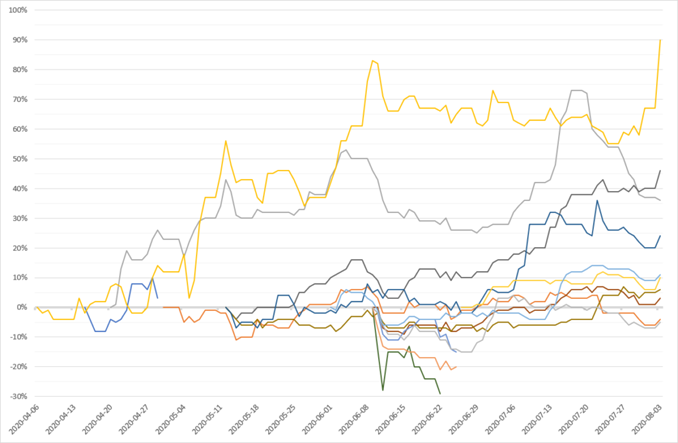
Below is a graph with the development of each picked stock. Some of them ended with a negative result, but most ended the period below with positive result. (6 and 9 stocks respectively).

Going forward
I haven’t figured out when to exit a stock, to know when to abandon a loss and when to cash in a winner. Now it is based on gut-feeling and that is no good. I want to figure out a sell trigger to use.
Figuring out that will be the goal for the autumn.
/Henrik
