Understanding the DOSBox debug screen

I have recently begun the journey of learning to code old DOS assembly and how to debug it in the debug version of DOSBox. And when being new to both, the debug screen in DOSBox is a bit overwhelming. So I have, in order to make myself understand it better and to make it easy for anyone else who want to follow my footsteps, decided to write this overview of the screen and its parts.
How the get the Debug screen
Firstly, to even see this screen in DOSBox, You’ll need to install a special debug version if it. You can download it from this page. If you already have DOSBox installed, you’ll only need to download the EXE-file and add it to the folder where regular DOSBox is installed.
DOSBox Debugger will start as the normal version of DOSBox, but with the additional debug screen showing. You can start an application as normal and then press Alt+Break and F5 to stop/start the execution of code. Or if you want to start debugging immediately, start the application by typing “debug” before the name of the executable. For example “debug myapp.exe”.
When the execution is stopped, you can type “help” in the debug screen to see additional commands to use. The commands are also listed on this page.
Required knowledge
In the text below I assume you are familiar with bits, bytes and hexadecimal formatting. Almost all numbers are shown in hexadecimal.
Register Overview
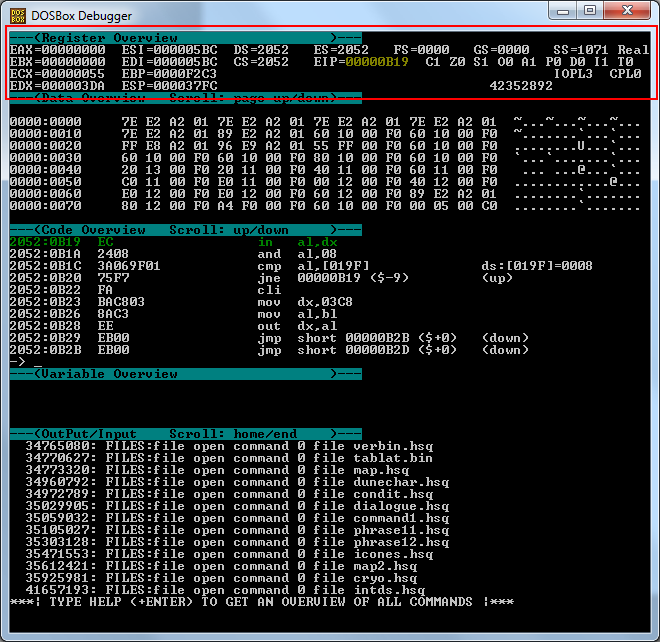
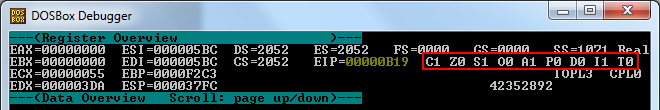
First section of the screen is the Register Overview. It shows all the registers, flags and their current values (There is also some other stuff on the right side I haven’t 100% figured out yet). The registers represent “memory slots” in the emulated CPU.
All values shown are displayed in big endian fashion. Meaning that the most significant byte is shown first.
Registers and flags that were changed by the previous executed instruction will be highlighted. In the above screen shot you can see that EIP was changed.

In the first column we have the four general purpose registers (Accumulator, Base, Count and Data) and their current 32-bit value.
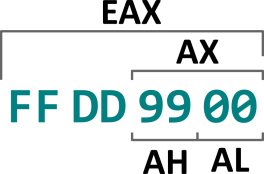
The bytes in the GPs can be referenced in code by four different ways. For example the bytes in the Accumulator can be referenced by EAX, AX, AH and AL. EAX will access all 4 bytes (32-bits), AX will access the two lower bytes (16-bits), AH will access the higher byte of AX and AL will access the lower byte of AX.
Meaning that if EAX is set to 0xFFDD9900, AX is 0x9900, AH is 0x99 and AL is 0x00.
The general purpose registers are not 100% interchangeable, as specific ones are used as input and/or as output location for various instructions.

The second column starts with the two Index registers, Source Index and Destination Index. They are used together with a section registers when working with string instructions. I will explain more about how they are combined later in this post.

The bottom two registers in the second column are the Base pointer and Stack pointer. The Stack pointer point the the current stack offset within the Stack segment. Base pointer is an extra pointer to the stack segment. It is used by higher level programming language to point the beginning of parameters for a subroutine within the stack. (The code I studied so far, does not make much use of the BP register. So I feel my knowledge about it is likely incomplete)
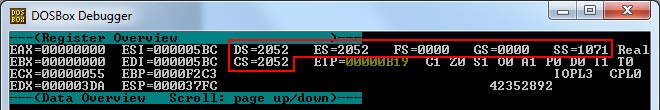
After the two columns we find a bunch of Segment registers. Each define a 64 Kb large region of memory space. Their value is an address in the physical memory divided by 16.
They are:
- DS: Data segment
- CS: Code segment
- SS: Stack segment
- ES, FS, GS: Extra segments. FS and GS can be referred to as Far segment and Global segment respectively, but there is no difference between them.
Together with a register in the second column they can point to a specific address in the memory. For example DS is often paired with SI. You get the physical addresses from a segment and pointer by multiply the segment with 16 and then adding the pointer value to it.
For example if DS is 0x2052 and SI is 0x05BC, the physical address will be 0x20ADC.
Hexadecimal:
  0x2052 x 0x10 + 0x05BC = 0x20ADC
Decimal:
  8274 x 16 + 1468 = 133852
Different segments can overlap and even point to exact same region. Because they can overlap, different looking segment + offset combinations can point to the same physical address.
In DOSBox the pairing a segment and register will look like DS:SI, CS:IP, SS:SP etc in the Code overview.
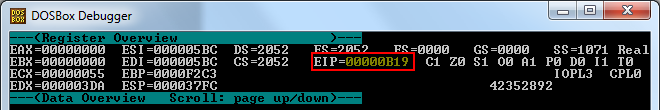
The last register is the Instruction pointer. Together with CS it points the memory location of the next instruction to be executed.
After all the registers and segments, we have the Flags. They are all single bit values, which means they can only be either zero or one. They can be changed when an instruction is executed and will also determine what some instruction will do when being executed. I will quickly go over them here, but I do feel they need a blog post of their own, for a more in-depth look.
- Carry Flag - Is set to 1 when the result of an arithmetic operation goes over max value or under min value for the register. Otherwise it is 0. It will also store the bit that is removed doing a shift or rotate operation.
- Zero Flag - Is set to 1 when the result of an arithmetic operation is zero or when two compared values are equal. A non-zero or non-equal result set flag to 0.
- Sign Flag - Shows if the result of an operation might be Two’s complement signed or not (that it might represent a negative number). It basically tells if the highest bit of the result is set to 1 or 0.
- Overflow Flag - Works as the Carry Flag, but treat all bytes as Two’s complement signed numbers (minus the shift and rotate part).
- Auxiliary Carry Flag - Works as the Carry Flag, but treats all bytes as BCD numbers (minus the shift and rotate part).
- Parity Flag - Shows if the number of 1-bits in the result of an arithmetic operation is even or odd. Set to 0 if even and to 1 if odd.
- Direction Flag - Used for direction when moving or comparing string data. Determines if the index values should be increased or decreased when executing a string operation. When set to 0 it will increase the indexes by 1 and when set to 1 it will decrease the indexes by 1.
- Interrupt Flag - Uses as an on/off switch for if external interrupts should be ignored or processed. External interrupt are disabled when the value is set to 0 and enabled when set to 1.
- Trap Flag - Used for Debugging.

These parts I not sure what they mean. I have not been able to find any information about IOPL3 or CPL0 at all. “REAL” I guess mean the program runs in real mode and not in protected mode. The big number I think is a CPU cycle counter. So far I managed to debug without knowing what they represent.
Data Overview
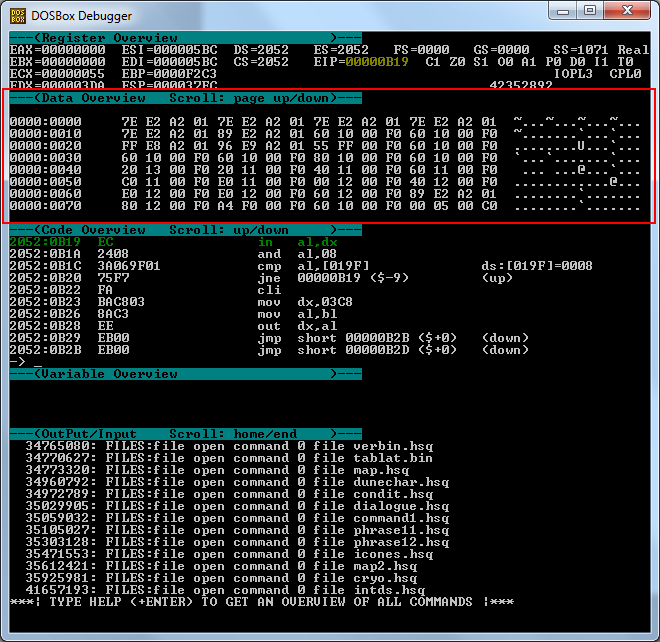
This overview show the RAM memory. All the 16 megabytes that DOSBox emulates can be viewed here. The first column shows the location as Segment:Offset values, the second shows bytes the in hexadecimal format and lastly it shows the bytes in ASCII format.
Besides scrolling with the page up/down buttons, you can jump to any segment by typing in “d” followed by a space and then the memory location as segment:offset. You can use any of the segment names and register names to make it easier. For example you can type “d ss:sp” instead of typing their values (like “d 1071:37FC”).
One thing to take note of, is that when data is read to or from a register the bytes switch order. Meaning if EAX is 0xFF22AABB and written to memory, the bytes will be ordered 0xBB, 0xAA, 0x22 and 0xFF in the Data overview and vice versa.
Code Overview

The Code overview shows memory data interpreted as code. It can view any part of the memory just like the Data overview. You can also jump to any part like in the data view. Just use command “c” instead of “d”.
Each line represents one instruction. A line starts with a segment:offset column, followed by the bytes that make up the instruction, then by the instruction in assembly code. Some lines ends with helpful text showing the expected result of a Jump instruction or the address and value being referenced in code.
The view only interpreters the bytes it shows and can sometimes make mistakes because of it. If you jump to a specific point, I recommend to scroll up a few lines above it to make sure it is correct.
Also, this view contains the command prompt at the bottom. Anything you type will show up here.
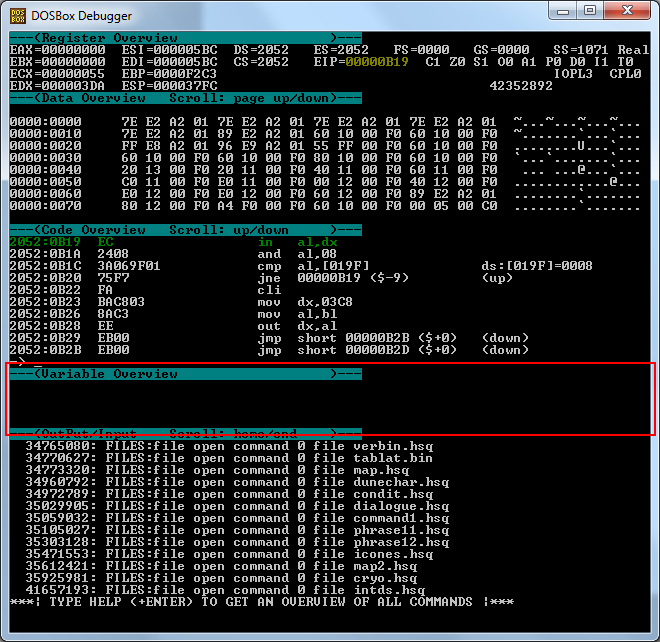
You can add names to memory locations and they together with their values will show up here (The names will also show up in the Code view). Unfortunately I have not used it much, so can’t say more than this about it.
Output/Input

A view that will print various information about what the running program does and the result of any command you have typed.
Tips
You can copy & paste text from and to the Debug window. It works the same way it works in the CMD window.
When dumping memory to file, DOSBox will try to dump the file where DOSBox is, but if that is under the Program Files folder, it might end up in %USERPROFILE%\AppData\Local\VirtualStore\Program Files (x86)\DOSBox-0.XX instead.
Sources
I have picked up things here and there, but these links are the main sources for this post.
Concluding remark
There is a lot more to programming and debugging with DOSBox than what I tried to explain here. But I still hope this post was at least a little bit helpful. If I didn’t manage to explained something, write a comment here (or try google. That might give you an answer much quicker :) ).
/Henrik