Dune reverse engineering - Tools for figuring out the image files

When I was trying to fully understand the image files, I had to dive into the binary code for the game. Which meant that I had to reference online documentation a lot, utilize a bunch of different tools and also build my own tool to help with the reverse engineering.
I would like to list these things to help others that want to reverse engineer Dune or any other DOS game. Starting with helpful links and ending with an overview of the tools I needed to make myself. The tools are a mess both code and interface wise so I won’t be sharing them I’m afraid.
Online documentation
This is not everything I had to read to start getting into reverse engineering (I had to learn basic x86 assembly for example). But these are the pages I found myself going back to more than once (The first link was used a lot).
- Intel Pentium Instruction Set Reference
- Interrupt Services DOS/BIOS/EMS/Mouse
- DOS INT 21h - DOS Function Codes
- Programmable Interval Timer
The tools
- UNLZEXE by Gerstrong
The executable for the floppy disk version of Dune is compressed. The code for the game is unpack in memory when the executable is started. This makes it a bit difficult to analyze the EXE-file in Ghidra. UNLZEXE can unpack it for you and give you a new executable to work with, which helps a lot.
- DOSbox debug version
DOSbox is a DOS emulator I use to play my old games. And with a special version of it, I can follow along with the execution step by step and view various memory values. I have written about it earlier here and here.
(I have recently learned there exists a branch of DOSbox that looks like it might be better for debugging called DOSBox-X, but I haven’t had time to test it yet)
- Ghidra
Ghidra is an application specifically made for reverse engineering. It has a bunch of features, but I mainly use it to view the binary as Assembly code. It allows me to add comments and add names to specific parts and memory locations. It allows for quick jumps between parts of the code and compliments the DOSbox debugger a lot.
- UltraEdit
My preferred text file editor which includes a hex editor. Useful for note keeping and viewing binary files. (This tool costs money, but free alternatives should be possible to find if you google.)
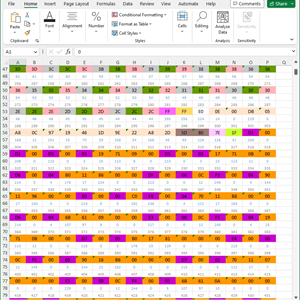
- Excel
The speardsheet tool that should not need an introduction. I use it for note taking, specifically for mapping memory address usage. It has helped me with figuring out what specific values are used for.
(A free alternative to this would be Google Spreadsheet or OpenOffice)
- VMMap from SysinternalsSuite
VMMap is a small tool that maps out the memory usage of an application. I have used this to find out the memory address to where DOSbox stores the emulated memory. Having that address allows for direct access to it without the need to dump it to a file first. I’ll explain why I needed to analyze the memory below.
My home-developed tools
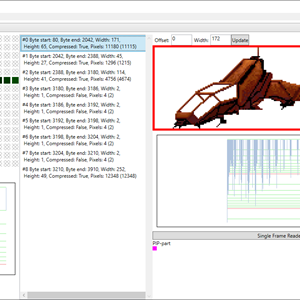
To understand the image files I developed two different tools. One “Image file analyzer” that worked with the image files and one “Memory analyzer” that worked with memory dumps. The latter allowed me to more easily see what the game did to the video buffers.
Both tools were written in C# with the .net framework.
And as mentioned above, neither code or bins will be released. They are not very user friedly and probably a headache to understand if you haven’t written them yourself. So instead of releasing it, I recommend you to learn how to create tools like this yourself.
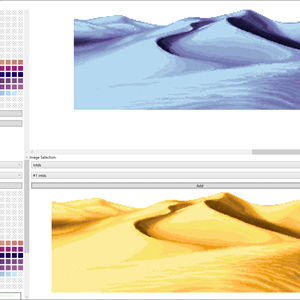
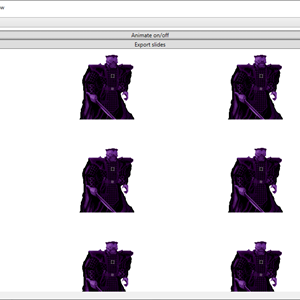
- The Image file analyzer
This tool was mainly developed to see if I understood the various details about the file format and game logic. As I gained more insights, I wrote logic to test my findings. It gave me nice visual results of all my labor.
The tool can read an image file and:
- Parse, display and extract images.
- Parse and display palettes.
- Combine different images to different palettes.
- Show the portrait animations.
- Show various statistics about the file.
- Create an Excel file that marks what each byte in the file is used for.
The last feature with creating Excel files was very useful. The logic that parsed the file would mark each byte as it was read, allowing me to see if any data was skipped. It also keeps track of if anything was read more than once, allowing me to see if the logic read “outside” the part it was supposed to read (reading into a different part).
- The memory analyzer
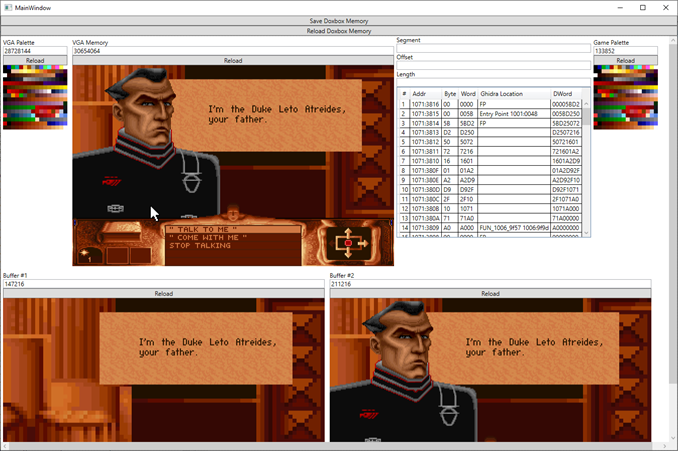
This tool was first made to parse the memory dumps you can get from Dosbox with the command “MEMDUMPBIN 0000:0000 1000000”, but it was extended to read Boxbox memory directly too.
The tool gave me the ability to:
- Read the memory for the virtual VGA card. Allowing me to render the current screen and palette used.
- Render images from the two video buffers the game creates and uses.
- Render the palette the game has loaded.
- Show an estimated stack trace. Using manually collected data, I can get a guess on which calls have been made.
Final words
That is it. Just remember, none of these tools solves anything without a lot of investigation and note keeping. No tool can give you the big picture of what is happening. You need to take all the small parts and make sense of them yourself.

